聚类方法-Kmeans实战

  k-means可能是最知名的聚类算法,它是很多入门级数据科学和机器学习课程的内容。下面来回顾一下。

算法步骤

  k-means算法的原理很简单,下面来回顾一下算法步骤。

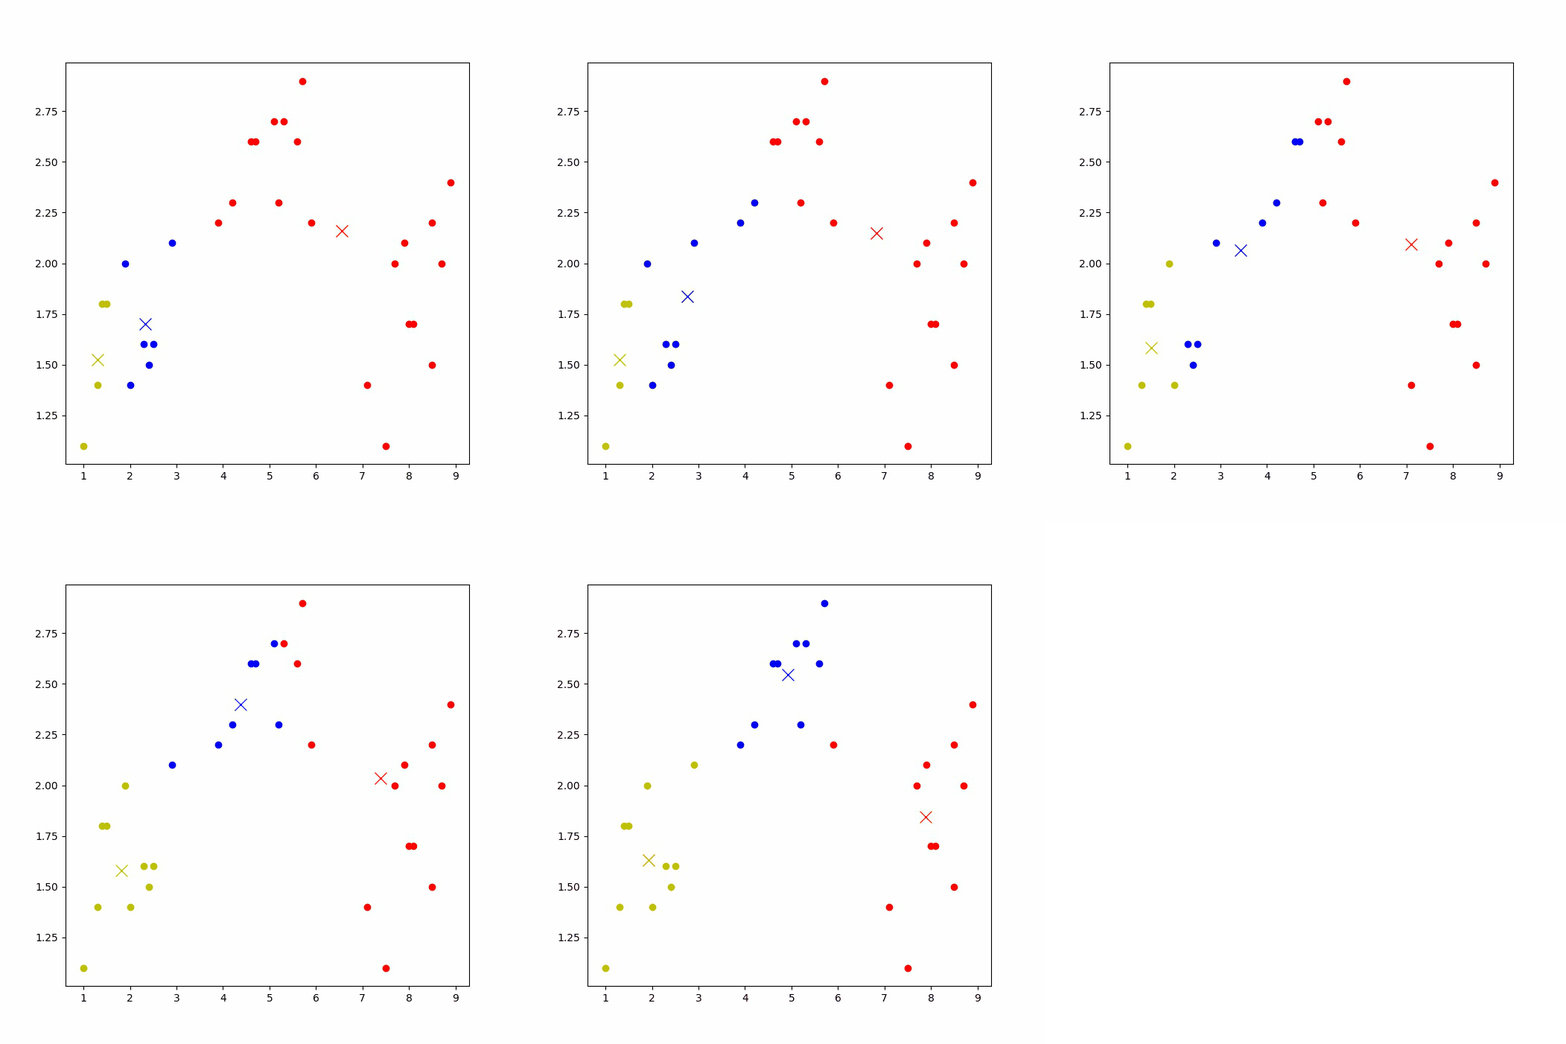
  • 首先,我们选择一些类/组,并随机初始化它们各自的中心点。为了算出要使用的类的数量,最好快速查看一下数据,并尝试识别不同的组。中心点是与每个数据点向量长度相同的位置,在上图中是「X」。
  • 通过计算数据点与每个组中心之间的距离来对每个点进行分类,然后将该点归类于组中心与其最接近的组中。
  • 根据这些分类点,我们利用组中所有向量的均值来重新计算组中心。
  • 重复这些步骤来进行一定数量的迭代,或者直到组中心在每次迭代后的变化不大。你也可以选择随机初始化组中心几次,然后选择看起来提供了最佳结果的运行。

优点与缺点

  K-means的优势在于速度快,因为我们真正在做的是计算点和组中心之间的距离:非常少的计算!因此它具有线性复杂度 O(n)。
  另一方面,K-Means 有一些缺点。首先,你必须选择有多少组/类。这并不总是仔细的,并且理想情况下,我们希望聚类算法能够帮我们解决分多少类的问题,因为它的目的是从数据中获得一些见解。K-means 也从随机选择的聚类中心开始,所以它可能在不同的算法中产生不同的聚类结果。因此,结果可能不可重复并缺乏一致性。其他聚类方法更加一致。

代码

1
2
3
import numpy as np
import matplotlib.pyplot as plt
%matplotlib inline

生成数据

1
2
3
4
5
6
7
8
9
# 造数据
x = [1.0, 1.3, 1.9, 1.5, 2.4, 2.0, 2.3, 2.9, 2.5, 1.4,
4.6, 3.9, 5.1, 4.7, 4.2, 5.6, 5.9, 5.3, 5.7, 5.2,
7.1, 7.5, 8.9, 8.0, 7.7, 8.1, 8.5, 7.9, 8.5, 8.7]

y = [1.1, 1.4, 2.0, 1.8, 1.5, 1.4, 1.6, 2.1, 1.6, 1.8,
2.6, 2.2, 2.7, 2.6, 2.3, 2.6, 2.2, 2.7, 2.9, 2.3,
1.4, 1.1, 2.4, 1.7, 2.0, 1.7, 1.5, 2.1, 2.2, 2.0]
color = ['r', 'b', 'y']
1
2
cluster_x = np.random.randint(0, 8, 3).tolist()
cluster_y = np.random.randint(1, 3, 3).tolist()
1
2
3
4
fig = plt.figure(1, figsize=(7, 7))
ax = fig.add_subplot(111)
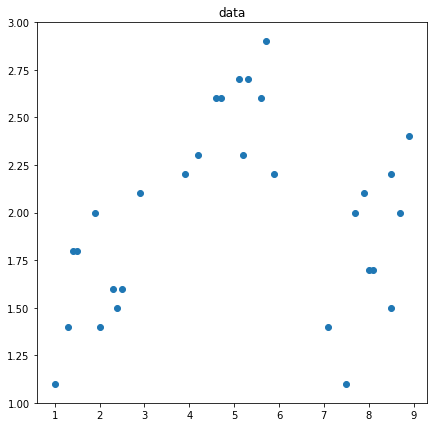
ax.scatter(x, y)
plt.title('data')

png

1
2
3
4
5
6
7
8
9
10
11
12
13
14
15
16
17
18
19
20
21
22
23
24
25
26
27
28
29
30
31
32
# 计算欧氏距离
def cal_distance(x1, x2, y1, y2):
return np.sqrt(pow(x1-x2, 2)+pow(y1-y2, 2))

# 开始算法
def kmeans(x, y, cluster_x, cluster_y):
new_belong_x = []
new_belong_y = []
new_center_x = []
new_center_y = []

for i in range(len(cluster_x)):
new_belong_x.append([])
new_belong_y.append([])

for i in range(len(x)):
distance = np.array([])
for j in range(len(cluster_x)):
distance = np.append(distance, cal_distance(x[i], cluster_x[j], y[i], cluster_y[j]))
belong = np.argmin(distance)
new_belong_x[belong].append(x[i])
new_belong_y[belong].append(y[i])

for i in range(len(cluster_x)):
if len(new_belong_x[i]) != 0:
new_center_x.append(np.array(new_belong_x[i]).mean())
new_center_y.append(np.array(new_belong_y[i]).mean())
else:
new_center_x.append(cluster_x[i] + 1)
new_center_y.append(cluster_y[i] + 1)

return new_belong_x, new_belong_y, new_center_x, new_center_y
1
2
3
4
5
6
7
8
9
10
11
12
13
14
15
16
17
18
plt.ion()
plt.draw()
plt.pause(1)
for i in range(5):
plt.clf()
print('epoch: {}'.format(i))
new_belong_x, new_belong_y, center_x, center_y = kmeans(x, y, cluster_x, cluster_y)
for j in range(len(new_belong_x)):
plt.plot(center_x[j], center_y[j], '{}x'.format(color[j]), markersize=12)
plt.plot(new_belong_x[j], new_belong_y[j], '{}o'.format(color[j]))
plt.draw()
plt.savefig('{}.jpg'.format(i))
plt.pause(0.5)
cluster_x = center_x
cluster_y = center_y

plt.ioff()
plt.show()

  运行后,可以看到下图的聚类过程(如果jupyter notebook上无法显示,则到IDE上运行)。
rnn

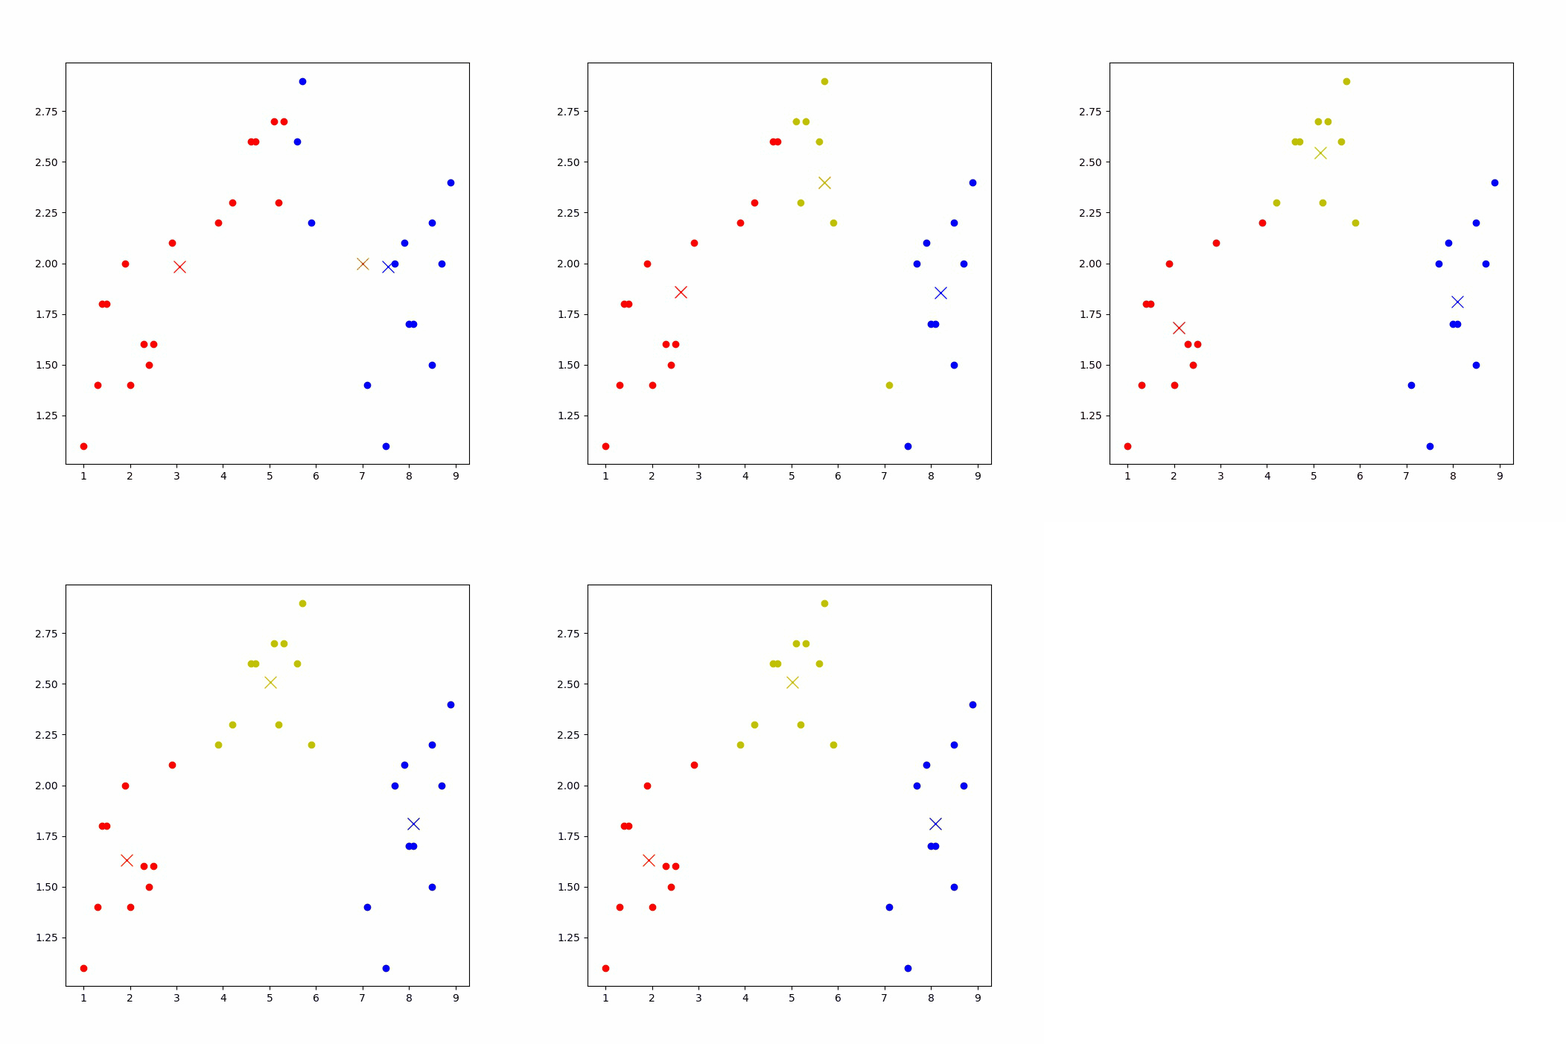
  再次运行代码,由于初始点选取的随机性,可能会得到不一样的聚类结果,如下图:
rnn

enjoy it!

参考资料:聚类算法合集
代码:https://github.com/nanyoullm/cluster-algorithm/tree/master/kmeans

0%